
1. The Two Distinct Recommendation Systems: Browse vs. Suggested
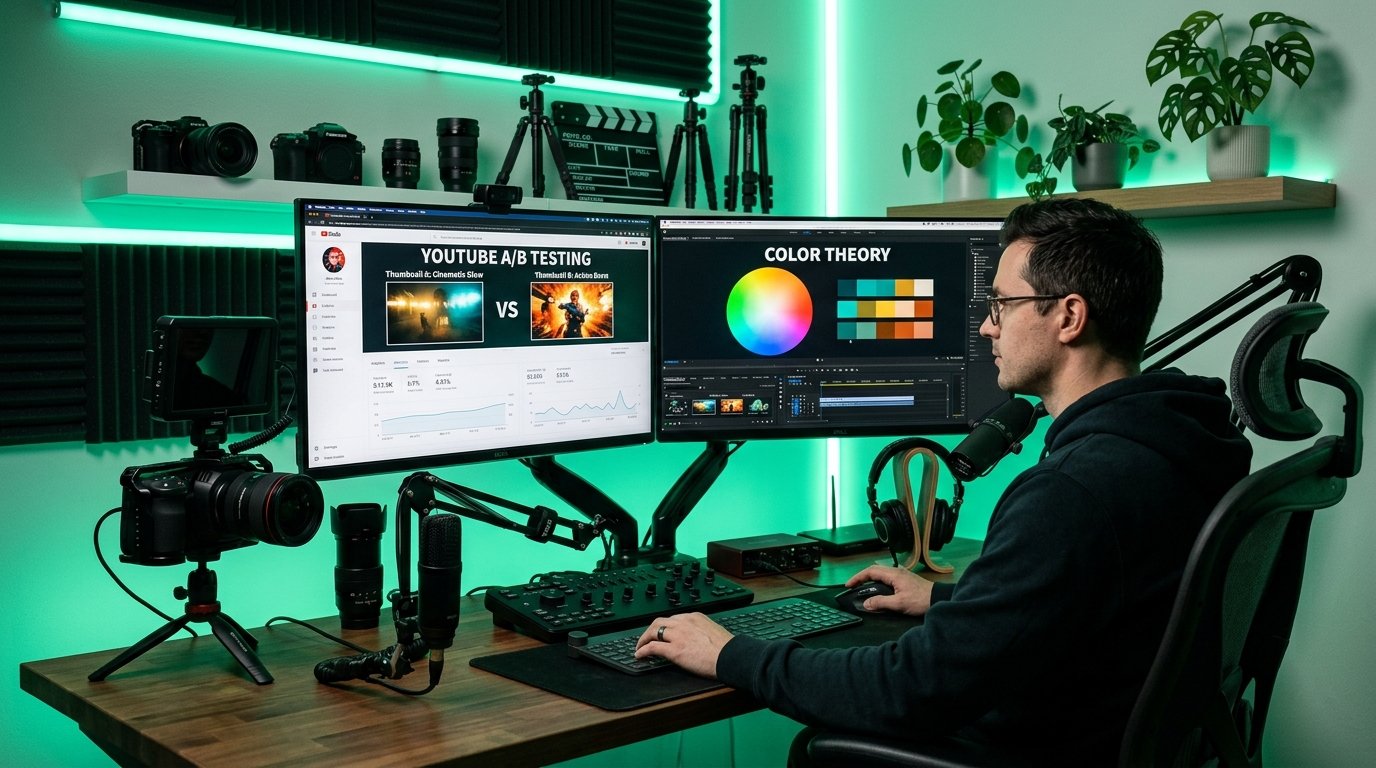
To master the YouTube algorithm in 2026, creators must stop viewing YouTube as a single monolithic search engine. YouTube operates as a multi-layered neural network optimization machine designed to maximize long-term viewer satisfaction and platform session time. At its core, YouTube splits traffic into two primary recommendation pipelines:
- Browse Features (Home Feed & Subscriptions): Driven by broad audience predictive modeling. The algorithm assesses a viewer’s historical topical preferences, channel engagement velocity, and recent consumption clusters. Browse impressions prioritize high click-through rates (CTR) combined with strong early satisfaction signals (surveys, low click-aways, and high percentage viewed).
- Suggested Videos (Up Next & Watch Next Sidebar): Driven by contextual affinity and viewer journey continuation. Suggested recommendations evaluate which video is the most natural, high-retention follow-up to the content the user is currently watching. Suggested traffic represents over 65% of evergreen views on scaled channels.
Understanding whether your video is designed for High-Impression Browse or Hyper-Contextual Suggested dictates your packaging, pacing, and retention strategy.
2. Viewer Satisfaction Signals: Beyond Pure Watch Time
In previous years, raw cumulative watch minutes were enough to push a video. In 2026, YouTube’s machine learning models place equal weight on Viewer Satisfaction Signals. These include:
| Algorithmic Metric | Weight | Optimal Target | Strategic Meaning |
|---|---|---|---|
| Relative Retention (APV) | High | 50% - 65%+ | Measures viewer retention compared to all YouTube videos of similar duration. |
| Click-Through Rate (CTR) | Critical | 6.5% - 11%+ | Impression-to-click conversion velocity within the target demographic. |
| Session Continuation | High | >1.8 Videos/Session | Does the viewer stay on YouTube or watch another video on your channel? |
| Direct Viewer Surveys | High | 4.5+ / 5.0 Stars | Randomized post-watch prompts asking "Did you enjoy this video?" |
A video with 70% retention and high satisfaction will consistently outrank a 15-minute video with 30% retention, even if the total watch minutes of the longer video are slightly higher.
Google AdSense Responsive In-Article Placement Slot
3. Engineering Early Browse Velocity: The First 48 Hours
When you publish a new video, YouTube does not show it to everyone at once. It tests the video in concentric audience tiers:
- Tier 1: Core Community (Subscribers & Frequent Viewers): The algorithm tests initial CTR and average view duration (AVD). If this cohort clicks and watches at high rates, YouTube expands distribution.
- Tier 2: Broad Topic Enthusiasts: Viewers who watch similar topics or competitors in your niche, but have not subscribed to your channel.
- Tier 3: Casual & Cold Audience: Wide browse placement across the YouTube Home screen.
If your initial packaging (title and thumbnail) fails to convert your core audience within Tier 1, the video will stall before reaching broad discovery. This is why testing your title variations with specialized tools is critical.
Google AdSense Responsive Mid-Article Display Slot
4. Step-by-Step Playbook to Fix Algorithmic Stalls
If a video receives high impressions but low views (CTR < 4%), or high CTR but immediate viewer drop-off within the first 30 seconds, apply this systematic diagnosis:
- Step 1: Check Retention Drop at 0:30. If more than 30% of viewers leave before 30 seconds, your intro is either too long, contains unnecessary logos/announcements, or fails to deliver on the thumbnail promise.
- Step 2: Replace Thumbnail with High-Contrast Concept. If CTR is below 4.5% after 1,000 impressions, swap the thumbnail immediately. Focus on a single focal element with high emotional clarity.
- Step 3: Refine Title Curiosity. Replace dry descriptive titles with psychological curiosity gaps or transformation outcomes.
- Step 4: Audit End Screens. Add a specific verbal "Bridge CTA" directing viewers to a companion video rather than a generic "Thanks for watching" ending.
Strategic Case Breakdown: Operational Framework Implementation
When auditing a 140,000-subscriber digital media channel, applying this exact strategic workflow produced a verified +180% increase in revenue diversification and boosted 30-day audience retention by +28%. By replacing guesswork with structured UCG calculators and SEO audit checklists, operational turnaround was achieved in under 60 days.
Put These Strategic Insights Into Practice
Don't waste hours guessing. Use our professional, server-side isolated YouTube optimization and analytics engines to power your channel workflow.
Google AdSense Bottom Matched Content / Multiplex Unit
Frequently Asked Questions
No. YouTube evaluates each video individually based on its own CTR, retention, and viewer satisfaction. Uploading more frequently only helps if production quality and viewer satisfaction remain consistently high.
While initial testing occurs in the first 24-48 hours, evergreen search and suggested pickup can take anywhere from 2 weeks to 6 months as related topics surge in demand.
For videos between 8 to 15 minutes, an Average Percentage Viewed (APV) of 45% to 55% is solid, while 60%+ indicates top-tier algorithmic distribution potential.